Skip to content
You are using an unsupported browser. For best results please use the latest versions of Chrome, Edge, Firefox or Safari.
ITS
Information Technology Services
Enterprise Service Centre
ITS System Status
UniversITy Service Catalogue
Search Site:
Search Site
About
Committees & consultations
ITS change management process
ITS core values
ITS policies & guidelines
IT@UofT Strategic Plan
Organizational structure
Resources
Your workplace environment
ITS units
Academic, Research & Collaborative (ARC) technologies
Digital Learning Innovation and Engagement (DLIE)
Enterprise Applications & Solutions Integration (EASI)
Enterprise Infrastructure Solutions (EIS)
Information Security (IS)
Planning, Governance & Assessment (PGA)
News & events
Events
In the Loop
ITS news
Contact
Bluesky
Instagram
LinkedIn
YouTube
Information Technology Services (ITS)
Browse:
Home
ITS Units
Enterprise Infrastructure Solutions (EIS)
Enterprise networking
Internet gateway traffic graphs
Internet gateway traffic graphs
Combined R&E and Internet IPv4 traffic (Last 24 Hours)
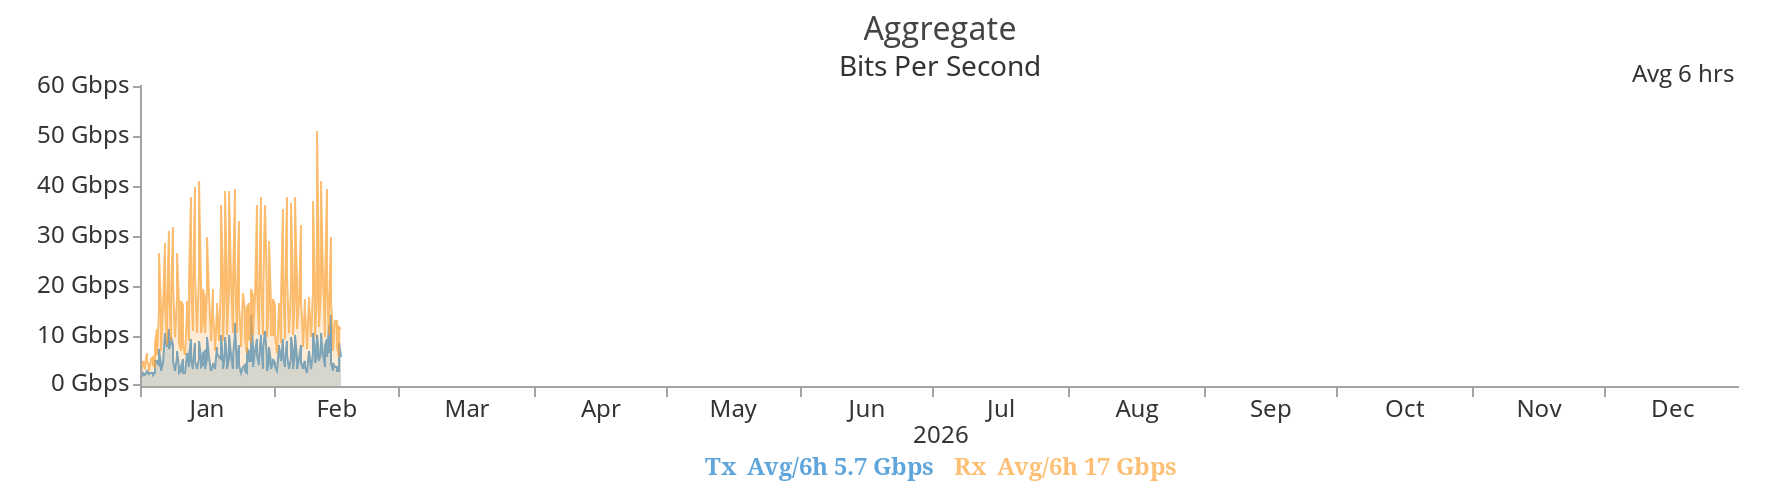
Combined R&E and Internet IPv4 traffic (2026)
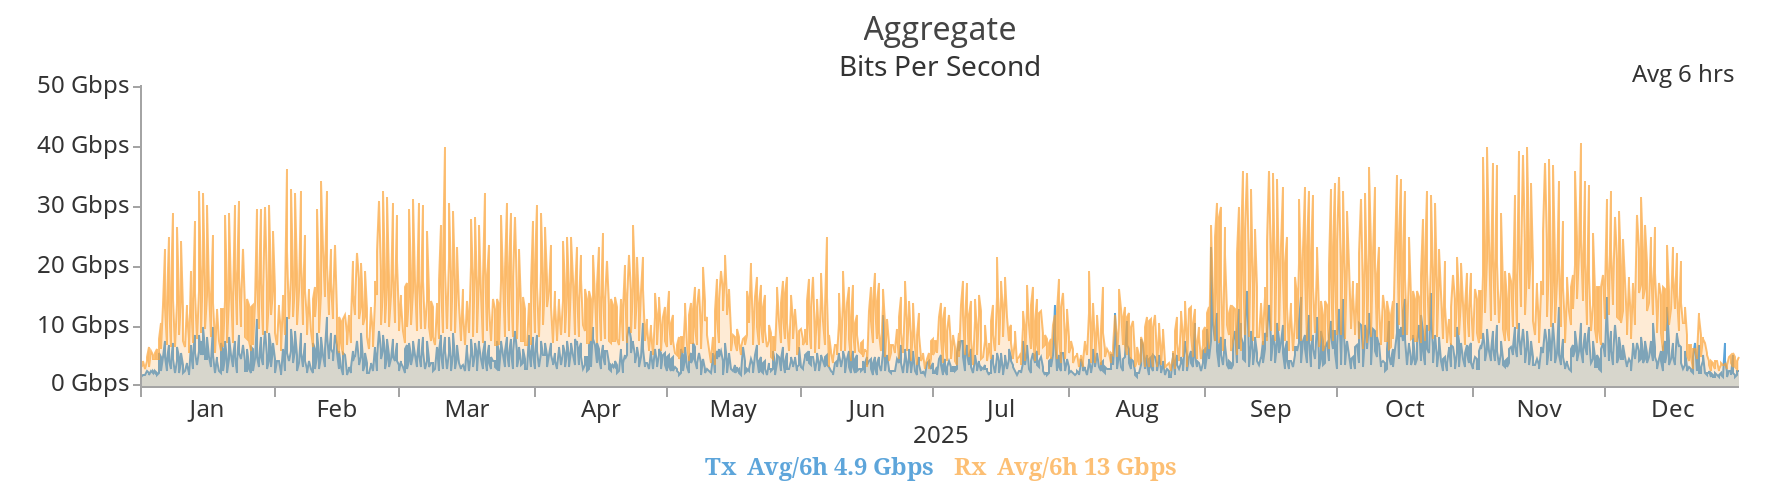
Combined R&E and Internet IPv4 traffic (Previous Year – 2025)
EIS organizational chart
Enterprise networking
Top level domain name request
Real-time WiFi usage maps (requires login)
Networking hardware & cabling standards
Campus WiFi & EduROAM
Network speed test
Internet gateway traffic graphs
Network as a Service (NaaS)
Hardware infrastructure
ITS System Status
Joint Operations Group (JOG)
UTORrecover
ITS Private Cloud Hosting Service
Systems & Solutions Group
Telecommunications
Using Teams Phone for VoIP