
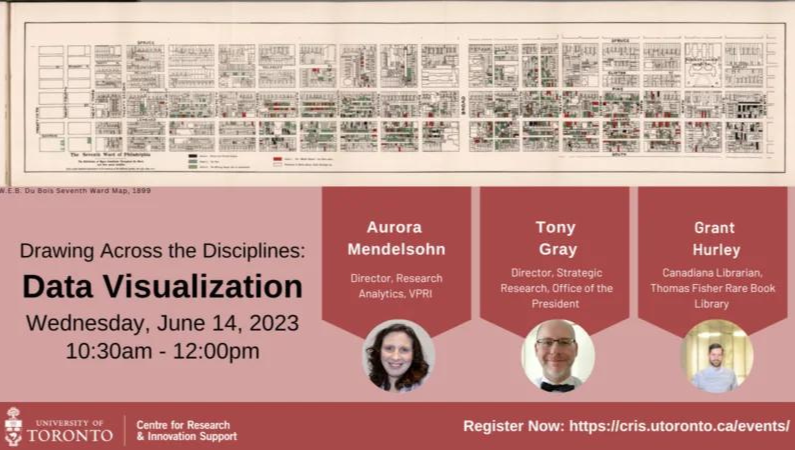
The Centre for Research & Innovation Support (CRIS) presents the next session in the new series: Drawing Across the Disciplines. In this session Drawing across the Disciplines: Data Visualization curators Tony Gray (Director, Strategic Research, Office of the President) and Aurora Mendelsohn (Director, Research Analytics, VPRI) discuss their new exhibit Emerging Patterns: Data Visualization Throughout History on view 22 May -18 August 2023 at the Thomas Fisher Rare Book Library. The session will be moderated by Canadiana rare book librarian, Grant Hurley, who is editing the exhibition catalogue. Additional curatorial support provided by Kelly Schultz (Map & Data Librarian).
Join us for Drawing Across the Disciplines: Data Visualization where the curators will discuss how they created this exhibit from the rich collection held at UofT and share their insights into the long history of data visualization and how data visualization operates in the current historical moment. Data visualizations are pervasive in our contemporary media however this session will provide key examples of why knowing the history of these visualizations is important to becoming a skilled, keen, and critical interpreter of how and why data is visualized.
The Map and Data Library offers a number of self-paced online courses and recordings of previously offered sessions. Learn more about our self-paced online courses.
For an overview of Data Visualization check out the library guide.
The Map and Data Library has this resource highlighting the importance of Equity, Diversity, and Inclusion for data and mapping emphasizing antiracist, feminist, queer, LGBTQIA2S+ and disability perspectives. Learn more about our resources.
To register for this event, visit the official event page.
